FAO Partnerships
CSO network mapping
TOWARDS TRANSFORMATIVE PARTNERSHIPS WITH CIVIL SOCIETY ORGANIZATIONS
1. INTRODUCTION: the actor network mapping tool of FAO
This digital brief informs FAO staff in Field Offices and HQ about a new tool to map FAO’s engagement with Civil Society Organizations that can support to establish and amplify strategic partnerships. CSO relational mapping is a practical tool to support the ‘transformative partnership’ element of FAO’s reinvigorated business model of the Strategic Framework 2022-31.
1 a. WHAT CAN THE TOOL DO?
The starting point for developing transformative partnerships is the analysis of existing partnership network. To facilitate the network analysis, mapping methodology has been created by PSU in collaboration with ITC-ILO.
1 b. WHY IS IT IMPORTANT?
Such live actor network map can help make evidence-based decisions on partnership development:
- to illustrate the status quo of the current CSO partnership network;
- to monitor change over time in network density and quality;
- to identify potential strategic engagement
1 c. WHICH TOOL?
The map visualizes the data with the help of a software that is cloud-based called Kumu (www.kumu.io) that can map social systems. The map can be used to visualize and analyze relationships between stakeholders, and explore the web of loyalties, interest, influence, and alignment of key players around important issues. It allows to capture the structure of networks and reveal key players (actor network hubs).
1 d. WHERE CAN IT BE USED?
CSO network map may be used for the following:
- In the process of CPF/UNSDCF development, map the status quo to illustrate who is where doing what
- At the inception of projects, map the stakeholders (and use for screening/selection)
- To identify gaps in partnership in the context of four Betters/CPF/Regional Initiatives to look for new CSOs
- To identify the weak links to explore to invigorate the relationship
- To identify the strength to explore to do more with the CSO
- To identifying partners for specific (ad-hoc) engagement when organizing workshop with targeted audience
- Make referral of CSOs across Divisions / projects
- To monitor and evaluate, by updating the data to capture and visualize change over time.
The data to generate the map can be entered centrally or directly by actors and maps are updated in real-time, allowing to monitor change as it happens. Data can be entered with excel sheets.
EXAMPLES OF FAO CSO MAPS
EXAMPLE 1
Illustrated below is a snapshot of the network map of the global CSO partnership network of the FAO. The map groups CSOs along the four ‘betters’ and draws a distinction between active and non-active partnership agreements. Actors are labelled by area of collaboration. The map shows at a glance that the network is complex, that some organizations are clearly better connected than others, and that collaboration emphasizes on selected result areas. In the interactive version of the map, the user can zoom into the network and analyze individual actors and single connectors.
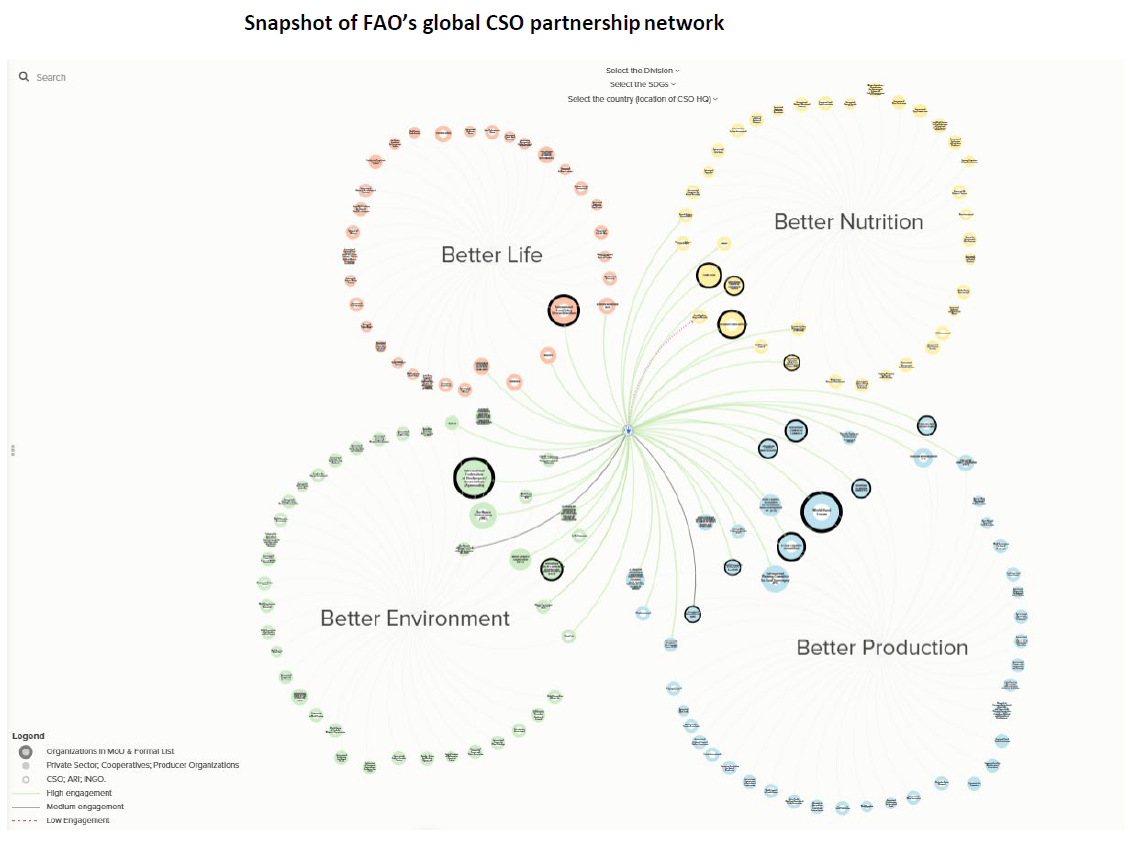
Source: https://embed.kumu.io/ed63db59271506948dd896b7cf6a4783
EXAMPLE 2
A second example of an actor network map developed in the Guyana Country Office is illustrated below. It represents the CSOs (grey) in the middle and their connections with both the Public services (red) and the external/support partners (yellow). The arc around the CSOs shows the objectives and services of the organization and the colour of the ties denotes the level of the connection.
Organized on these 3 groups of organizations, the system map visualization immediately makes us realize how densely but mostly weakly connected the organizations are (red connections).
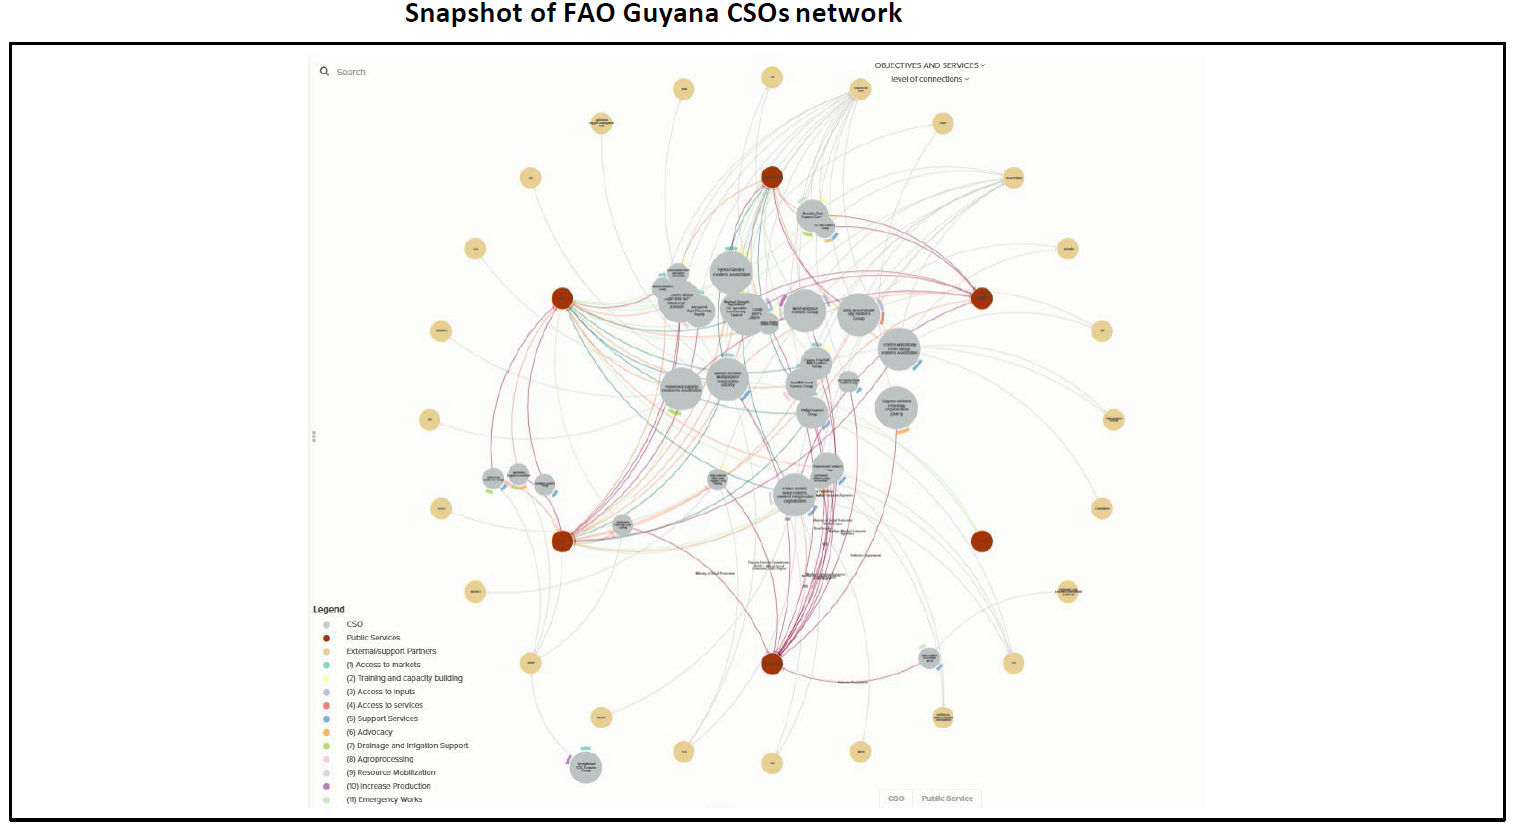
Source: https://embed.kumu.io/bff9647d83ad4beec61f9bc31fc7d738
2. STEPS TO BUILD THE MAP
The following steps can be followed to create CSO actor maps.
- Step 1: identify what we wish the map to illustrate and for what purposes (i.e. the intended use of the map)
- Step 2: define the map parameters and identify the data needs
- Step 3: compile/collect additional data as needed
- Step 4: create the map (version 1)
- Step 5: review/validate the map and identify the adjustment needed
- (step 3-5 repeats as required)
- Step 6: training and hand-over (training might start at earlier stage)
Step 1 and 2: PLANNING
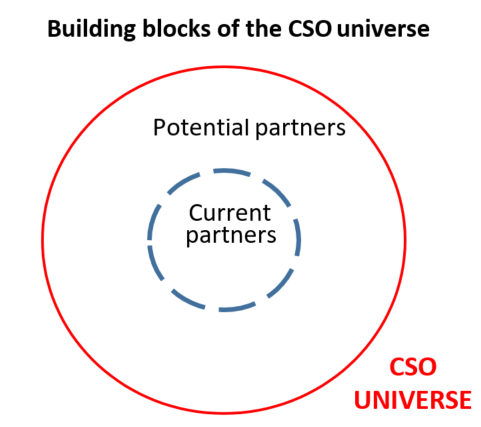
The starting point is stocktaking is analyzing the existing partners and partnership network. To this end, the concerned office needs to develop a database or list of current contacts, and define its CSO universe. Most likely, the universe of CSO (i.e. the sum total of CSOs working in fields linked to the FAO mandate) will exceed the number of current network partners. Each CSO linked to FAO by way of a partnership constitutes a network actor. A mapping plan should then be developed to define the objectives, boundaries and parameters of the map.
Step 3 to 5: CREATION OF THE MAP
Based on the mapping plan, existing data is prepared/processed to be in a visual form. Supplementary data is collected where applicable. Upon creating the map, validate the information (with the CSOs if applicable), review if the map answers the questions that were defined in the planning sheet, and make adjustment of the parameters and visual effects. These steps repeats until the map that serves the intended purposes is developed.
Step 6: MAINTENANCE OF THE MAP
Capacity is built at DO/HQ Division so that the map can be adjusted and updated by the map owner office. This step may starts earlier.
3. RESOURCES REQUIRED
Staff time to define the specifications of the map, take stock of existing data, collect additional data if applicable, clean the data, and review the draft map. Upon finalization of the map, to update the map regularly.
Technical support: actual production of the map (currently collaboration is planned with ITCILO)
Duration: approximately 6 months
For more information about what is a transformative partnership, the intervention areas and the theory of change, download the PDF